


TEG and ROTEM Technology
By David Whiting, MD, FAAP
Department of Anaesthesia, Perioperative and Pain Medicine, Division of Cardiac Anesthesia
Boston Children’s Hospital, Boston, MA
Thromboelastography (TEG) and rotational thromboelastography (ROTEM) are point of care viscoelastic tests of hemostasis in which the strength of global clot formation and dissolution is measured in real time. These technologies provide a visual assessment of clot formation and subsequent lysis under low shear conditions similar to those present in venous circulation.1
The primary clinical indication for the use of ROTEM and TEG is the rapid diagnosis of specific coagulation deficiencies in bleeding patients. ROTEM and TEG assess clot formation/dissolution kinetics and strength by measuring and displaying the amount of a continuously applied rotational force that is transmitted to an electromechanical transduction system by developing clot.
Whole blood samples are analyzed or collected in a 3.8% sodium citrate tube and re-calcified before analysis. In the TEG system, 340 µl of whole blood is pipetted into a cylindrical cup that oscillates through 4°45’ every five seconds. A pin is suspended in the blood by a torsion wire. As the viscoelastic strength of the clot increases, more rotation is transmitted to the torsion wire and detected by an electromagnetic transducer. In the ROTEM system, a cylindrical cup containing a 340 µl whole blood sample remains fixed while a pin suspended on a ball bearing mechanism oscillates through 4°75’ every six seconds. As the viscoelastic strength of the clot increases, the rotation of the pin is impeded and detected optically using a charge coupled device image sensor system. The TEG device is more sensitive to vibration because the pin is stationary, (unlike the ROTEM device where the more stable cup is stationary) and must be maintained on a level and stable bench. The TEG device requires manual pipetting and can analyze two samples at a time. The ROTEM has automated pipetting and can analyze 4 samples simultaneously.
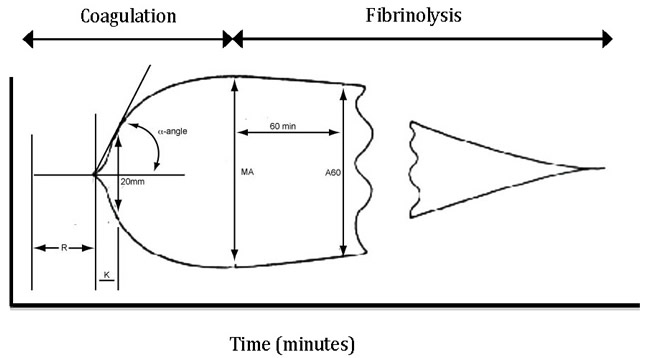
ROTEM and TEG provide essentially the same information on the strength and kinetics of clot formation but the results are not exchangeable2 and the nomenclature is different. (Table 1) The systems generate a continuous tracing with relative clot strength on the x-axis and time on the y-axis (Figure 1) The clot initiation time (R or CT) and the speed of clot formation (K and CFT) reflects the function of the classic intrinsic and extrinsic coagulation pathways. The slope of the tangent line to the evolving curve between two and 20mm of relative strength (α-angle) is the rate of clot strength amplification and reflects fibrin buildup and cross-linking. MA or MCF is the maximum strength of the clot and is reflective of interactions between fibrin, platelets and factor XIII. Fibrinolysis is measured by the rate of dissolution of clot and is represented by the lysis 30 and 60 times in the TEG system and the LI 30 in the ROTEM system.
Standard ROTEM and TEG assays are summarized in Tables 2 and 3. Results are compared to known standards and can guide clinical therapy. Paired assays are used when an abnormal result can have multiple causes. Prolonged reaction times in Kaolin TEG (R and K) or EXTEM assays (CT and CFT) are usually consistent with low levels of clotting factors or the presence of anti-thrombin agents including heparin. Reversal of heparin, transfusion of fresh frozen plasma or administration of specific clotting factors might be indicated. Low peak amplitude or clot strength (MA or MCF) can indicate thrombocytopenia, poor platelet function, or low fibrinogen levels. FIBTEM/EXTEM or Kaolin TEG/functional fibrinogen TEG paired assays can help determine the cause of low clot strength. Low MA or MCF that normalizes in the FIBTEM or functional fibrinogen TEG assay suggests that fibrinogen levels are normal or elevated, and thrombocytopenia or platelet dysfunction is the cause of low clot strength.
Table 1. TEG and ROTEM nomenclature

Table 2: ROTEM tests
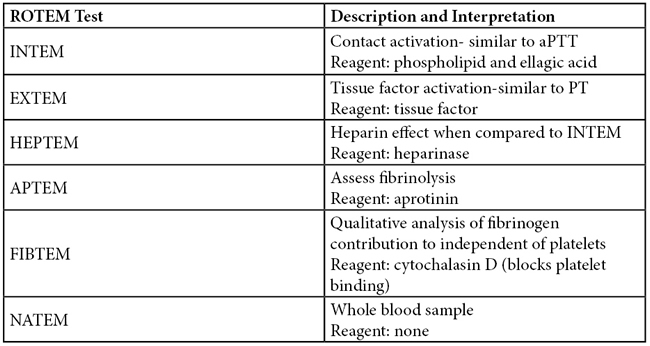
Table 3: TEG tests

Figure 1. Normal TEG tracing
REFERENCES
- Whiting D and DiNardo JA: TEG and ROTEM: Technology and clinical applications. Am J Hematology. 2014 Feb; 89(2): 228-32.
- Hartert H: Blood coagulation studies using thromboelastography, a new evaluation technique [in German]. Klin. Wochenschr. 1948; 26:577–83.
- Nielsen VG: A comparison of the Thrombelastograph and the ROTEM. Blood Coagul. Fibrinolysis 2007; 18:247–52.
- Shankarraman V, Davis-Gorman G, Copeland JG, Caplan MR, McDonagh PF: Standardized methods to quantify thrombogenicity of blood-contacting materials via thromboelastography. J. Biomed. Mater. Res. Part B Appl. Biomater. 2012; 100:230–8.
- Larsen OH, Fenger-Eriksen C, Christiansen K, Ingerslev J, Sørensen B: Diagnostic performance and therapeutic consequence of thromboelastometry activated by kaolin versus a panel of specific reagents. Anesthesiology 2011; 115:294–302.


